

by Dr. Hrishikesh Venkataraman, External Collaborator and Project Partner, Indian Institute of Information Technology (IIIT)
 The Indian Institute of Information Technology (IIIT), represented by Dr. Hrishikesh Venkataraman and Dr. Raja Vara Prasad, is an international collaborator of the London Digital Twin Research Centre (LDTRC). The research conducted in Sri City, India, aims to support and drive forward the advancements in our Digital Twin for Industry 4.0 project, with an extended focus on anomaly detection mechanisms that can be integrated in the Digital Twin for manufacturing processes.
As part of the project activity funded by the UK-India Education and Research Initiative (UKIERI) and the Department of Science and Technology (DST), India, the research paper “CATS: Cluster-Aided Two-Step Approach for Anomaly Detection in Smart Manufacturing” was accepted for publication in The Fourth International Conference on Computing and Network Communications (CoCoNet’20).
In the age of smart manufacturing, there are typically a multitude of sensors that are connected to each assembly line. The amount of data generated could be used to create a Digital Twin model of the complete process. A digital twin is a virtual replica of a physical object or process of interest, that acquires knowledge about the real asset by analysing the data pertaining to it. Twin models are subsequently known to adapt themselves to monitor, control the entity and even take real-time decisions on its behalf. An important aspect of Digital Twin is the automation of the detection and prediction of anomalies in the manufacturing process. Anomalies can be identified by patterns that do not conform to the expected behavior. They have been referred to as outliers, discordant observations, exceptions, aberrations, surprises, peculiarities, or contaminants in different application domains.
For a smart manufacturing scenario, it is imperative to detect the anomalies with a greater accuracy within a stipulated duration of time. A major problem in anomaly detection is the amount of accuracy that could be obtained. Typically, as the anomaly increases, the prediction accuracy goes down significantly. However, if there has to be a high accuracy (say >90%) irrespective of the outliers, the time taken for anomaly prediction increases exponentially, going even up to several minutes. It is this particular challenge that has been addressed in this work. A clustering based N-step approach is proposed to increase accuracy and also reduce the time required for anomaly detection. Among the existing alternatives, the following well-established techniques were employed for our use case: DBSCAN (Density-Based Spatial Clustering with Applications in Noise), LOF (Local Outlier Factor) and Isolation Forest.
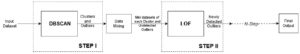
Block diagram of the proposed N-step approach.
The DBSCAN method (Step I) is fundamentally a clustering technique that functions on the principle of the relative density of data points. The data points existing in a denser vicinity are clubbed together and flagged as clusters. The contrasting feature of DBSCAN is its ability to identify the data points that fall outside the clusters as Noise. The second technique, LOF, implements the concept of relative density to detect outliers. Every point in the dataset is evaluated for a suspicious index that is governed by the pre-defined local neighborhood rules. Based on a threshold value for the index, the points are identified as inliers or outliers. The third technique, Isolation Forest, is a random partition-based technique. It attempts to isolate individual points with imaginary lines of partition. The basic idea behind this procedure is that outliers lying in a region of sparser vicinity are isolated with fewer lines of partition than the inliers. Based on the partition lines required, an anomaly score is generated and the data points are classified. As an initial part of our work, an algorithm was designed employing only two techniques namely: DBSCAN and LOF.
The performance of two-step approach is evaluated by conducting an experiment, wherein the same dataset is fed repetitively, but with an increased population of outliers. The question addressed was: what is the threshold value for the outlier population beyond which the performance starts declining? For the experiment, the desired value for accuracy was set as 95%. A dataset with nearly 3000 data points was considered with 20 distinct clusters. The outliers were systematically incremented by 1% from 10% to 25% outlier population (OP). The results showed us that the two-step approach resulted in an accuracy of >= 95% till the outlier population is 16%. Beyond that, the accuracy declines reaching 82% when the outlier population is 25%. Importantly, the computation time varied from 60 – 88 seconds, i.e., less than 1.5 minutes, thereby showing the time efficiency of this technique.